

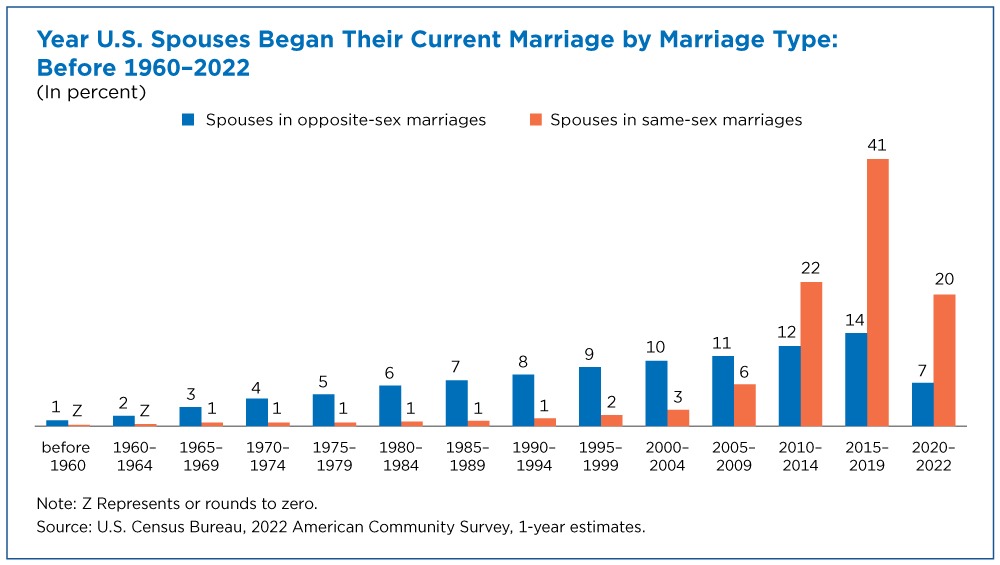
Same-sex marriages reached a peak between 2015 and 2019, right after the U.S. Supreme Court’s 2015 decision to legalize same-sex marriage in all states and most spouses in same-sex marriages tied the knot after 2003, when Massachusetts became the first state to legally recognize same-sex marriages.
About 41% of same-sex spouses married between 2015 and 2019 compared to 14% of those in opposite-sex marriages, according to a new U.S. Census Bureau report that analyzes 2022 data.
By distinguishing between male-male and female-female married couples, the report also examines whether characteristics of spouses in same-sex marriages are similar for men and women.
The report paints a national portrait of spouses in same-sex couples and their households, finding that on average they were younger; more likely to have a bachelor’s degree; and more likely to have married in the past year than those in opposite-sex marriages.
Characteristics of spouses in same-sex and opposite-sex couples differ depending on when they married. For example, spouses in same-sex marriages who married after 2015 tend to be older than those in opposite-sex marriages.
Year U.S. Spouses Began Their Current Marriage by Marriage Type: Before 1960-2022
By distinguishing between male-male and female-female married couples, the report also examines whether characteristics of spouses in same-sex marriages are similar for men and women.
How spouses in opposite- and same-sex marriages compared in 2022:
Among all spouses — regardless of when they married — those in same-sex marriages (46%) were more likely than those in opposite-sex marriages (34%) to be younger than 45. The opposite was true among spouses who married after 2015: 78% of those in opposite-sex marriages were younger than 45 vs. 65% of those in same-sex marriages.
Out of all spouses, men in opposite-sex marriages (71%) were more likely to be in the labor force and employed than women in opposite-sex marriages (58%). Among same-sex married couples, the percentage of men (74%) and women (75%) who were employed did not significantly differ.
Children under 18 were more common in opposite-sex married-couple households. About 38% of these households included a child of the householder, compared to 18% of same-sex married-couple households.
Among households with children, same-sex married-couple households were more likely to have only adopted (21%) or only foster (2%) children of the householder present than opposite-sex married couple households (2% and 0.2% respectively).
Living in an apartment was twice as common for same-sex married-couple households, consistent with the higher proportion of same-sex married-couple households in urban areas.


Discussion about this post