
The FINANCIAL — Georgia’s real GDP growth constituted a strong 5.5% year over year (YoY) in the second quarter (Q2) of 2018, according to the Geostat figures. Recently this year, IMF and World Bank upped their forecast of economic growth for Georgia from 4.2% to 4.5%. In August, the National Bank of Georgia (NBG) has also revised its forecast for 2018 from 4.8% to 5.5%. Meanwhile, ISET-PI expects annual growth in 2018 to be 6.3% YoY.
The second quarter’s buoyant mood is fueled in part by high economic growth rates in neighboring countries reflecting positive dynamics in external factors. The Armenia economy advanced 7.2% YoY in Q2 2018, following a 9.6% growth in the previous quarter. Azerbaijan (+1.3% YoY) and Russia (1.9% YoY) benefited from higher oil prices, while FIFA World Cup had an additional positive impact on the latter. The Turkish economy was still growing by 5.2% YoY in the second quarter of 2018. Notwithstanding the relatively respectable figure, this was the weakest growth rate for Turkey since the last quarter of 2016. Weakened independence of the central bank, sharp depreciation of lira, double digit inflation, and emerging geopolitical threats were the main challenges for the Turkish economy going into the second half of 2018.
All in all, the generally favorable regional economic environment helped boost Georgia’s exports of goods and services and the inflows of remittances. Together with continued strong performance of hospitality sector and increased FDI, it stimulated economic growth in Q2 2018. The main internal driver of GDP growth in the reporting period was a continued strong credit expansion, predominantly in the retail sector.
Inflation
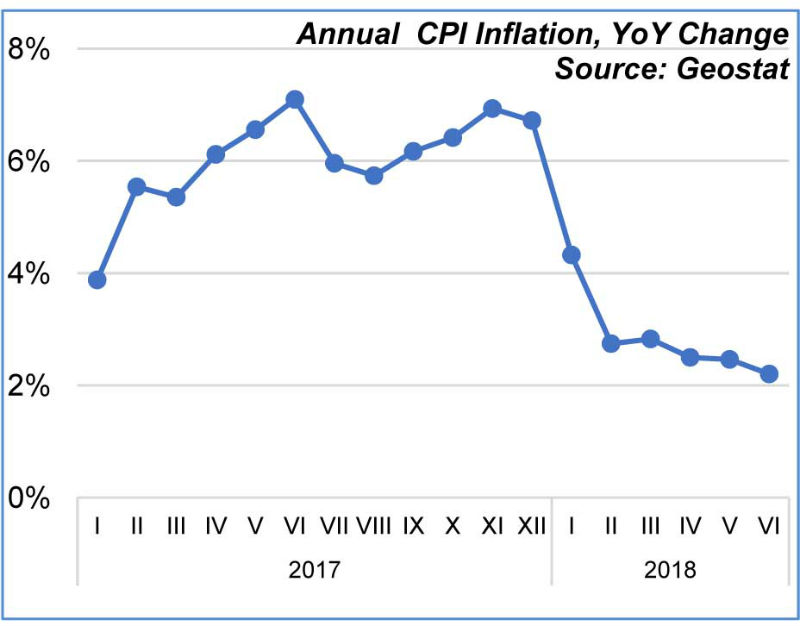
In Q2 2018 the CPI inflation rate fluctuated around the targeted level as the effect of the one-off supply side factors was exhausted in the beginning of the year and lari’s effective exchange rates appreciated. Overall, the annual inflation in April-June stood at 2.9% – in line with the 3% NBG target. Increasing food and oil prices on international markets were the main drivers of CPI inflation. The prices on Food and Non-alcoholic Beverages increased by 2.8% and 3.7% YoY respectively. Together with healthcare products (+ 4.5% YoY), these categories contributed 1.36 percentage points (pp) to the overall CPI inflation. The increase in tariffs on natural gas since August 2017 and the increase in water and electricity tariffs since January 2018 also had a perceptible effect on inflation. The contribution of the latter factors to consumer price increase was 0.4 pp in Q2 2018.
Prices of clothing and footwear dropped by 6.1% YoY. This decrease is explained by the depreciation of the Turkish lira, as Turkey remains the main import source of textile and apparel in Georgia. Together with communication (-1.2% YoY) these categories drove annual inflation down in Q2 2018 (contributing -0.3 pp to total inflation).
According to NBG’s forecast made in August 2018: “Other things equal, the inflation both this year and in the medium term will fluctuate around the target rate. The macroeconomic risks have risen given the regional developments, causing increased volatility on financial markets. However, even in case these risks are realized, the significant deviation of inflation from its target is not expected.”
External Sector
The external merchandise trade of Georgia surged by 25.3% YoY in Q2 2018, driven by both export and import growth.
Total exports jumped by 29.9% YoY and amounted to 860.3 million US dollar. The growth was driven by the doubled re-exports of cars, a tenfold increase in exports of tobacco products and a 40% increase in ferro-alloys exports. Georgian “car” industry, which includes car and spare parts re-exporters and repairers, benefitted from the improving economic performance in the region, especially in Azerbaijan – the major market for car re-exports. This market was lost temporarily starting from 2014 due to a recession in Azerbaijan and the imposed non-tariff regulations on car imports, which allow to import only cars that meet the Euro-4 ecological standard. It seems that the new excise tax scheme on cars introduced in Georgia in 2017 facilitated adaptation to the Azeri requirements. The hike in exports of tobacco products also could be explained by tax incentives – increased excise tax on cigarettes and other tobacco products and imposed regulations on tobacco products’ promotion, selling and consumption possibly shrank domestic market or just made the exports more profitable for local producers (as exports of tobacco are tax free). The main destination countries for Georgia’s tobacco products (mainly cigarettes, manufactured tobacco, and tobacco substitutes) are Azerbaijan, Uzbekistan, and Singapore. Overall, the main destination markets for Georgian export products in Q2 2018 were Azerbaijan (14.9% of total), Russia (12.3%), Turkey (8.1%), Armenia (8%) and China (7.7%). Despite the significant growth of exports to EU during the last years, exports to CIS grew even faster, in Q2 2018 49% of total Georgian exports ended up in CIS countries, while the share of EU countries was only 19%. This statistics underlines the problem of low diversification of trade and high exposure to regional shocks.
Imports amounted to 2,323.5 million US dollar in Q2 2018, a 23.8% YoY increase. This figure was mainly driven by the petroleum imports (+31.6% YoY), which was in turn driven by higher oil prices on international markets (the amount of imported petroleum was nearly the same as in the second quarter last year). Imports of gas turbines from Netherlands and motor cars from USA were among other main drivers of import increase in the reporting period. The main source markets for Georgian imports in Q2 were Turkey (16.8% of total), China (10.4%), Russia (10%), USA (6.9%), and Ukraine (5.6%). Because of growing imports, the negative trade balance deepened by 21% YoY.
Both tourism and remittance transfers maintained double-digit annual growth in Q2 2018. The number of international visitors increased by 13.8% YoY, while the change in tourist numbers (visitors who spent 24 hours or more in Georgia) was even higher – a 20.4% annual increase. As usual, the highest share of total visitors to Georgia were from neighboring countries – Russia, Azerbaijan, Turkey, and Armenia. Leaders in the YoY percentage increase of international visitors in Q2 were China (+92.7% YoY), Germany (56% YoY), and Poland (38.3% YoY). As a result, international tourism receipts in Q2 showed a 28.6% YoY increase, which means that this year an average tourist spent more than in the previous year.
Driven by higher inflow of money transfers from Italy (+36% YoY), Israel (+30.8% YoY), Greece (+22.3% YoY) and USA (+15.4% YoY) the volume of total remittances to Georgia increased by 14.8% YoY in the reporting period. Money inflow from Russia and Turkey were flat in Q2 due to the depreciation of local currencies against US dollar.
Net foreign direct investment in Georgia also showed positive dynamics in Q2 2018 – a 9.4% YoY increase. Energy sector, transport and communications, and financial sector were the largest FDI recipients. Going forward, the decrease in FDI levels is expected, as BP is finalizing its construction of gas and oil pipelines in the South Caucasus.
Exchange Rate
The positive development of external sector caused the strengthening of national currency exchange rate against the currencies of Georgia’s main trading partners, US dollar and the euro in the beginning of 2018. To smooth the currency appreciation, NBG bought 50 million US dollar in four auctions in April-June. Overall, in the Q2 2018, compared to the previous quarter the lari appreciated by 1.6% and 4.4% against the US dollar and euro respectively. In the same period lari strengthened against the Turkish lira and Russian ruble by 13.8% and 9.5% respectively. Lari also gained against Azerbaijani manat by 1.5% and Armenian dram by 1.7%.
These currency trends were reflected in effective exchange rates. In the second quarter of 2018, compared to the previous quarter the Georgian lari appreciated in both nominal and real terms by 6.1% and 4% respectively. That means that Georgian export goods and services became more expensive, while imports prices lowered.
Credit Market
In Q2 2018, total loans (stocks) granted by commercial banks, excluding interbank loans, increased by 25.5% YoY. While this growth was mainly driven by the rapid acceleration of retail loans (+30.3% YoY), business loans also revealed an increasing trend (+19.9% YoY).
Expanding credit activity was one of the drivers of economic growth in Q2 2018, however in the long-term it could create risks in financial sector and rise overindebtedness of Georgian households. To promote sustainable credit practices and improve lending conditions, NBG has published a working draft law on standards for retail loans, which aims to avoid an extensive growth of retail loans over the transition period, and decrease the amount high-risk financial products on the market.
Total deposits of enterprises and households in commercial bank also showed a notable increase of 21.5% YoY in Q2 2018. In contrast with loans, the main drivers of the rise were deposits made by legal entities (+26.7% YoY, probably the growth was affected by CIT reform and, therefore, freed financial resources), while individuals deposits increased by 16.6% YoY.
The results of the dedollarization measures implemented in the beginning of 2017 already had an effect in the short-term. Dollarization of both loans and deposits fell by 4.2 and 6.7 pp respectively in Q2 2018 compared to the same period of previous year.
Budget
In Q2 2018, the general budget was in surplus by 102.3 million lari, which was 228.8 million lari higher compared to the same period previous year. Due to higher than expected economic growth budget revenues from taxes increased by 8.5% YoY in the reporting quarter. Main sources of increase were revenues from VAT (+14% YoY), custom duties (+1792% YoY) and personal income tax (+17% YoY).
At the same time, current expenditures of government were flat in Q2, a 0.7% YoY increase. While compensation of employees (-3.6% YoY) and use of goods and services (-1.9% YoY) contracted in the reporting quarter, government increased social benefits and other expenses by 2.1% and 5.1% YoY respectively.
In Q1 2016, the common budget surplus decreased by 60% year over year, primarily a result of a 12.7% increase in government expenditures, while the income of the common budget increased by only 6.3%. General government debt stock totaled 13,162 billion lari, a 14% year-over-year increase. From this amount, 21% was domestic debt, while the remaining 79% was foreign debt.


